
I just noticed that my work is now on display on the UIUC Graphic Design BFA website! This is such an exciting moment for me, especially because this project was something entirely new to me. It was part of my ARTD 351 class, where we dove into the world of visual data visualization using data from the 2024 Paris Olympics. I had the chance to explore a whole new way of communicating information through design.
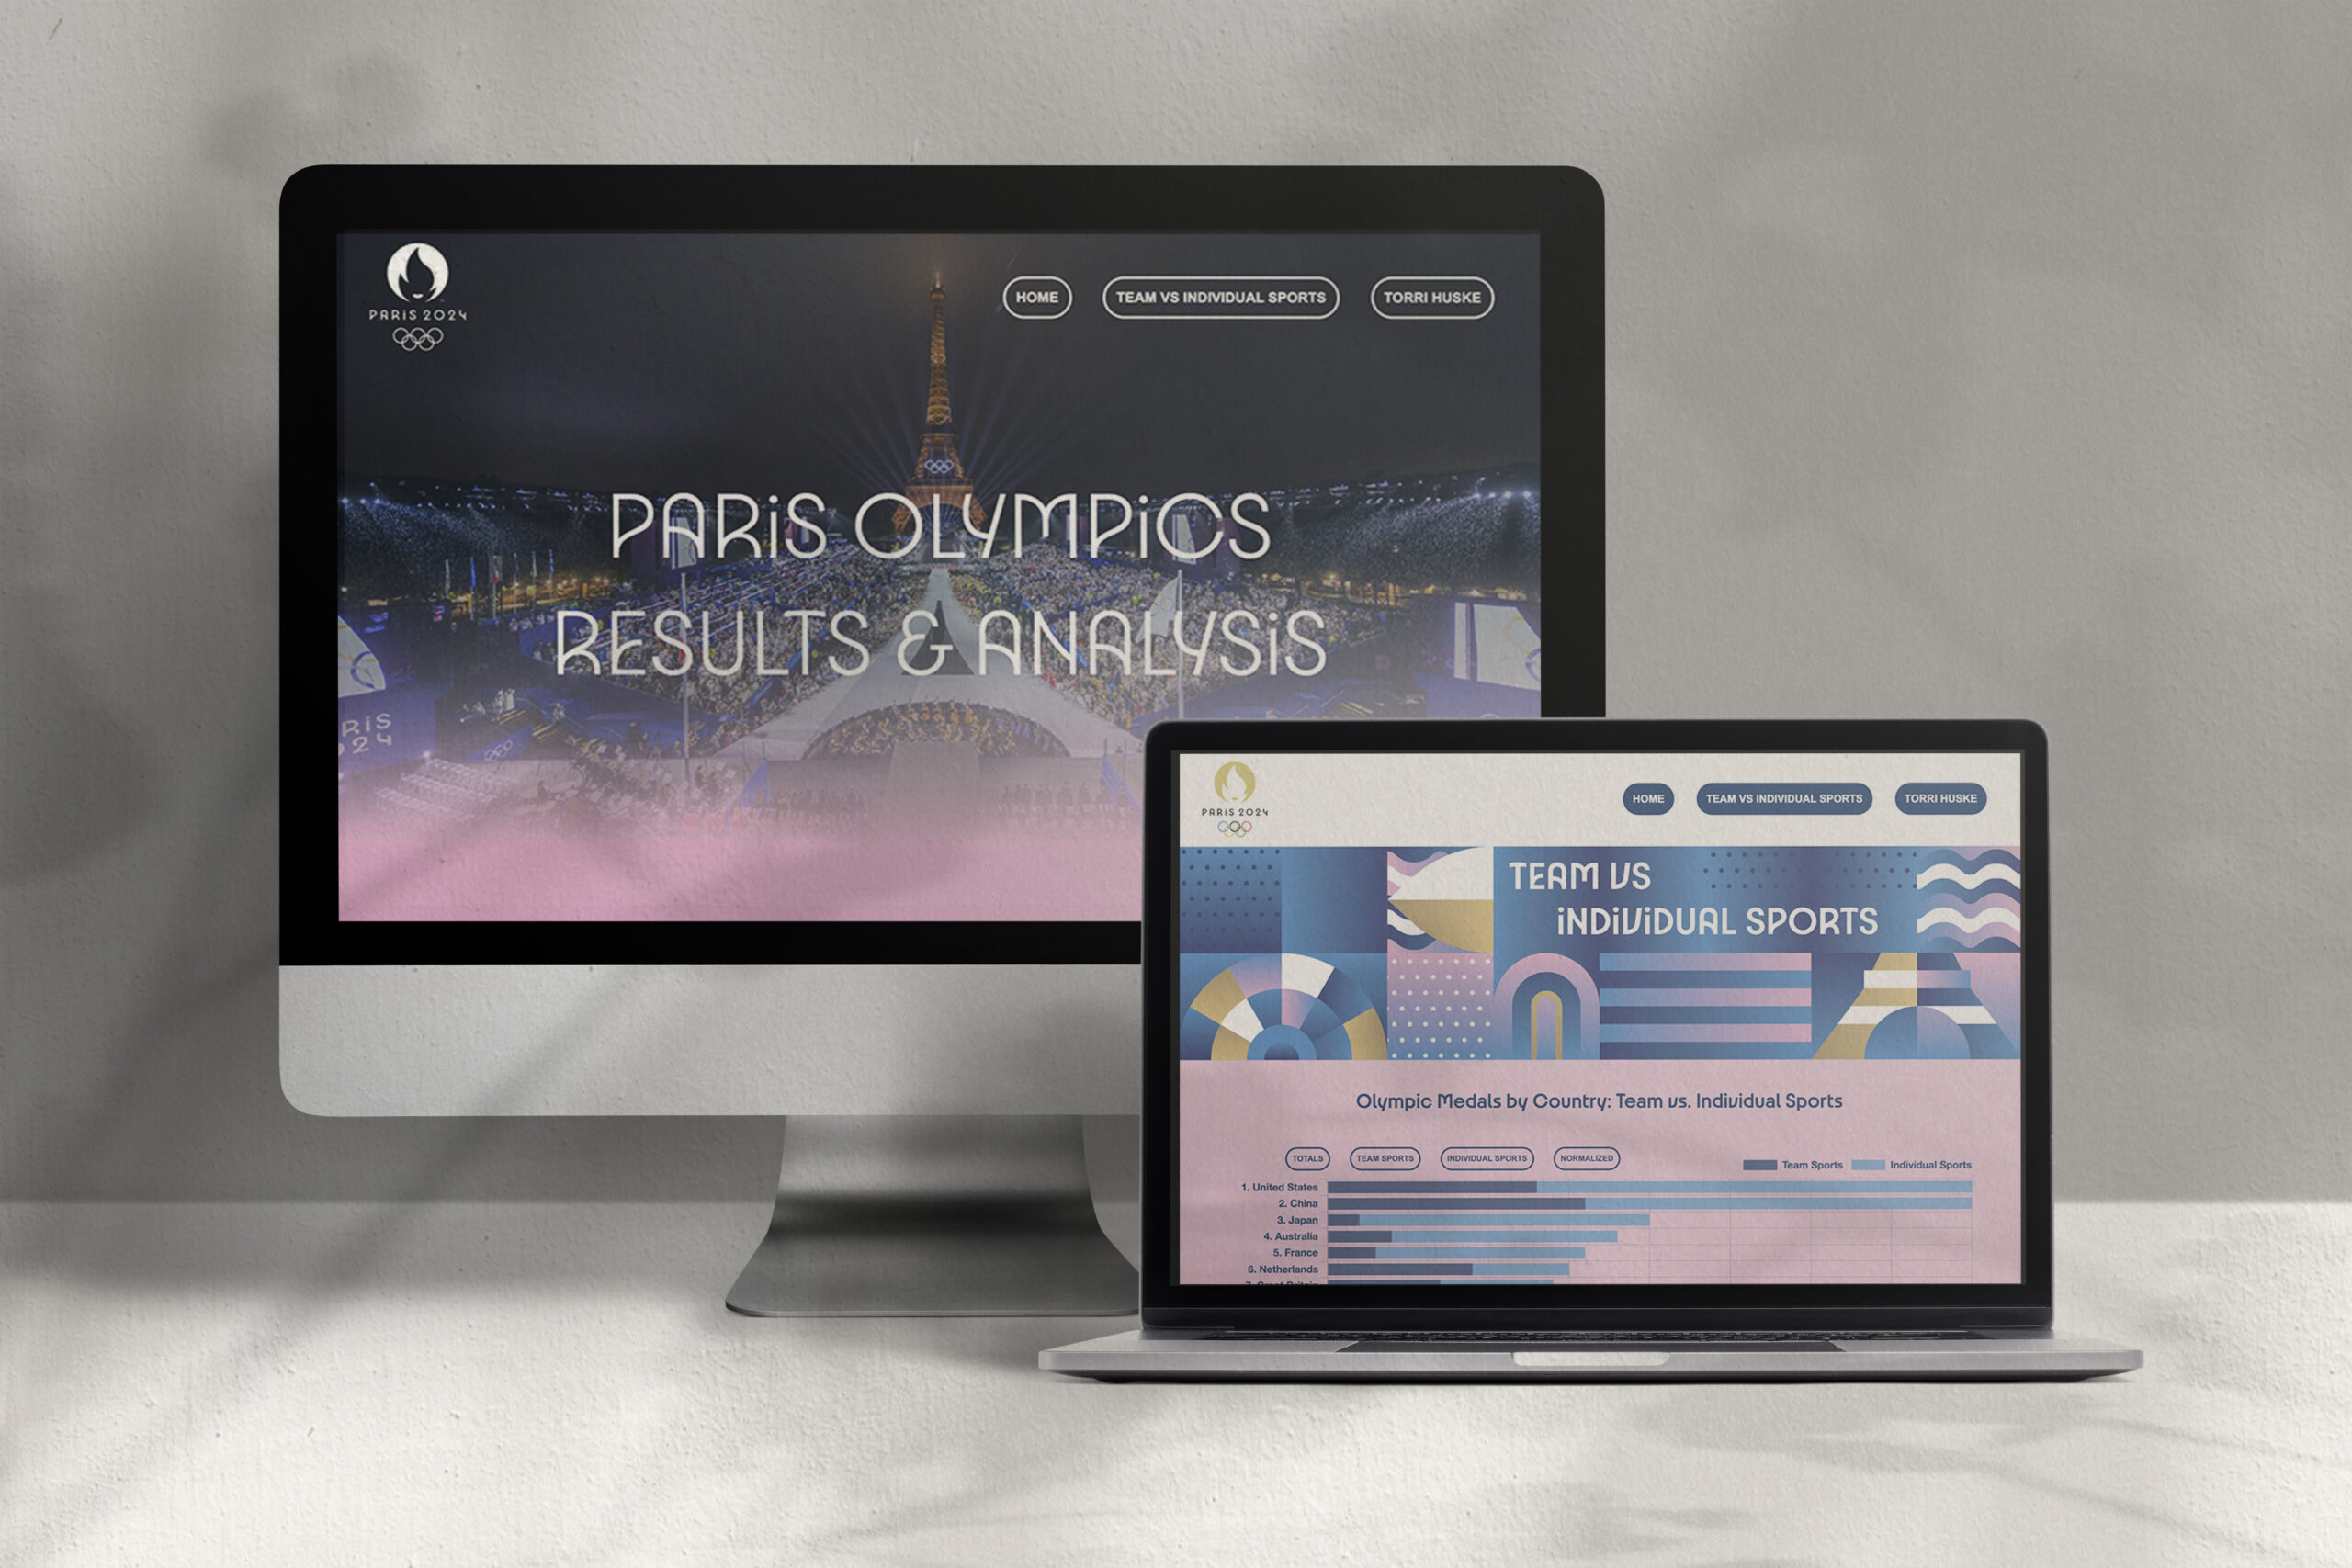
For this project, I analyzed the Olympic Games dataset, focusing on two key aspects. First, I examined the evolution of the games, with a particular focus on the trends between team vs. individual sports and the gold medal counts by country. Then, I looked at Torri Huske’s journey to gold, creating time-based visualizations to tell the story of her performances in both individual and team events.
What made this project especially exciting for me was that it was my first time working with data visualization. I had to learn how to code and work with different libraries (such as Chart.js) to bring the data to life. It was challenging at first, but I really enjoyed the process of translating raw numbers into something visually engaging and interactive. The goal was to create an experience that not only made the data more accessible but also highlighted the athletes’ incredible achievements in a way that was easy for others to understand and explore.
Being able to showcase this work on such a prominent platform like the UIUC Graphic Design website feels like such a rewarding accomplishment. It’s amazing to look back and see how far I’ve come from the start of this project. It has definitely sparked a new interest in working with data in design, and I’m excited to keep exploring this area in the future!
You can check out the full project here!