
Duration
5 weeks
Deliverables
Data Visualization
High Fidelity Website
Tools
Visual Studio Code
Figma
HTML, CSS, JavaScript
Excel
Overview
This project analyzed the Olympic Games dataset, focusing on the organization of the games and a detailed competition review. It examined the evolution of the games, exploring unique aspects such as competition formats and performance trends. The first part analyzed gold medal trends by country in team vs. individual sports, highlighting national strengths in various competition types. The second part centered on Torri Huske’s journey to gold, creating a time-based visualization of her progress in both individual and team events, capturing the timing, dates, and venue connections that contextualize her accomplishments.
Research - Part 1
I compiled comprehensive spreadsheets detailing all gold medal data from the 2024 Olympics, categorizing each entry by team sports, individual sports, and overall totals. Given the larger volume of individual sports data, I created an additional sheet with normalized values to allow for a balanced comparison of each country's success across both categories.
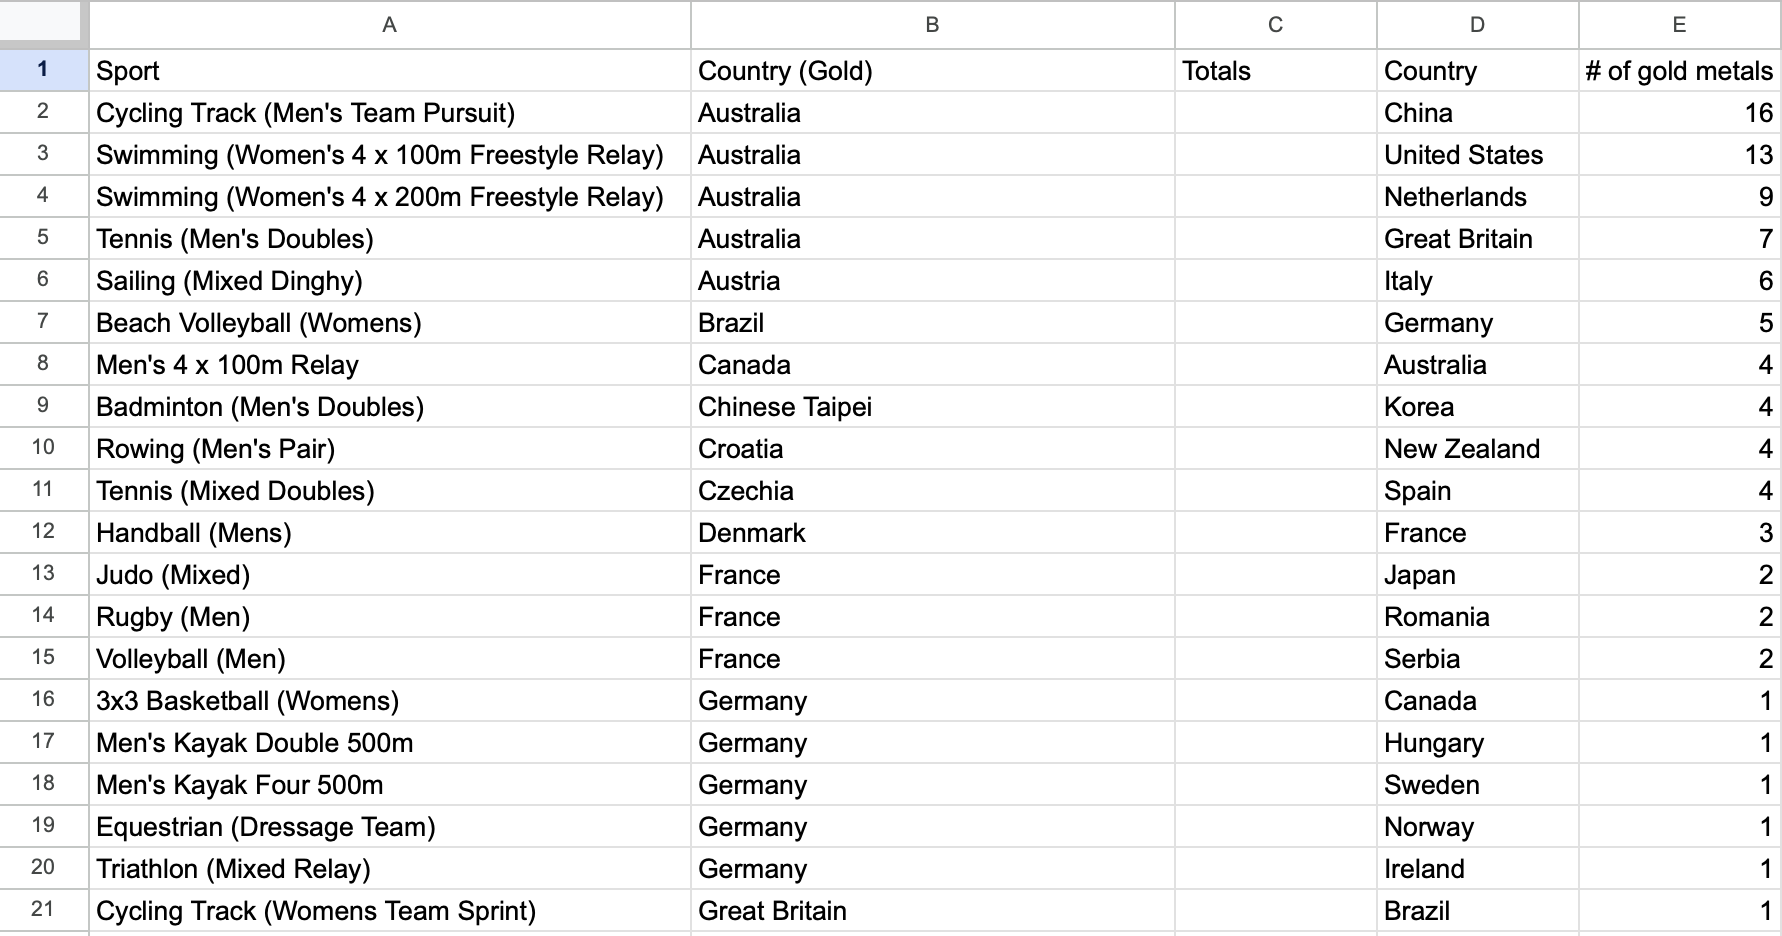
Team Sports Results
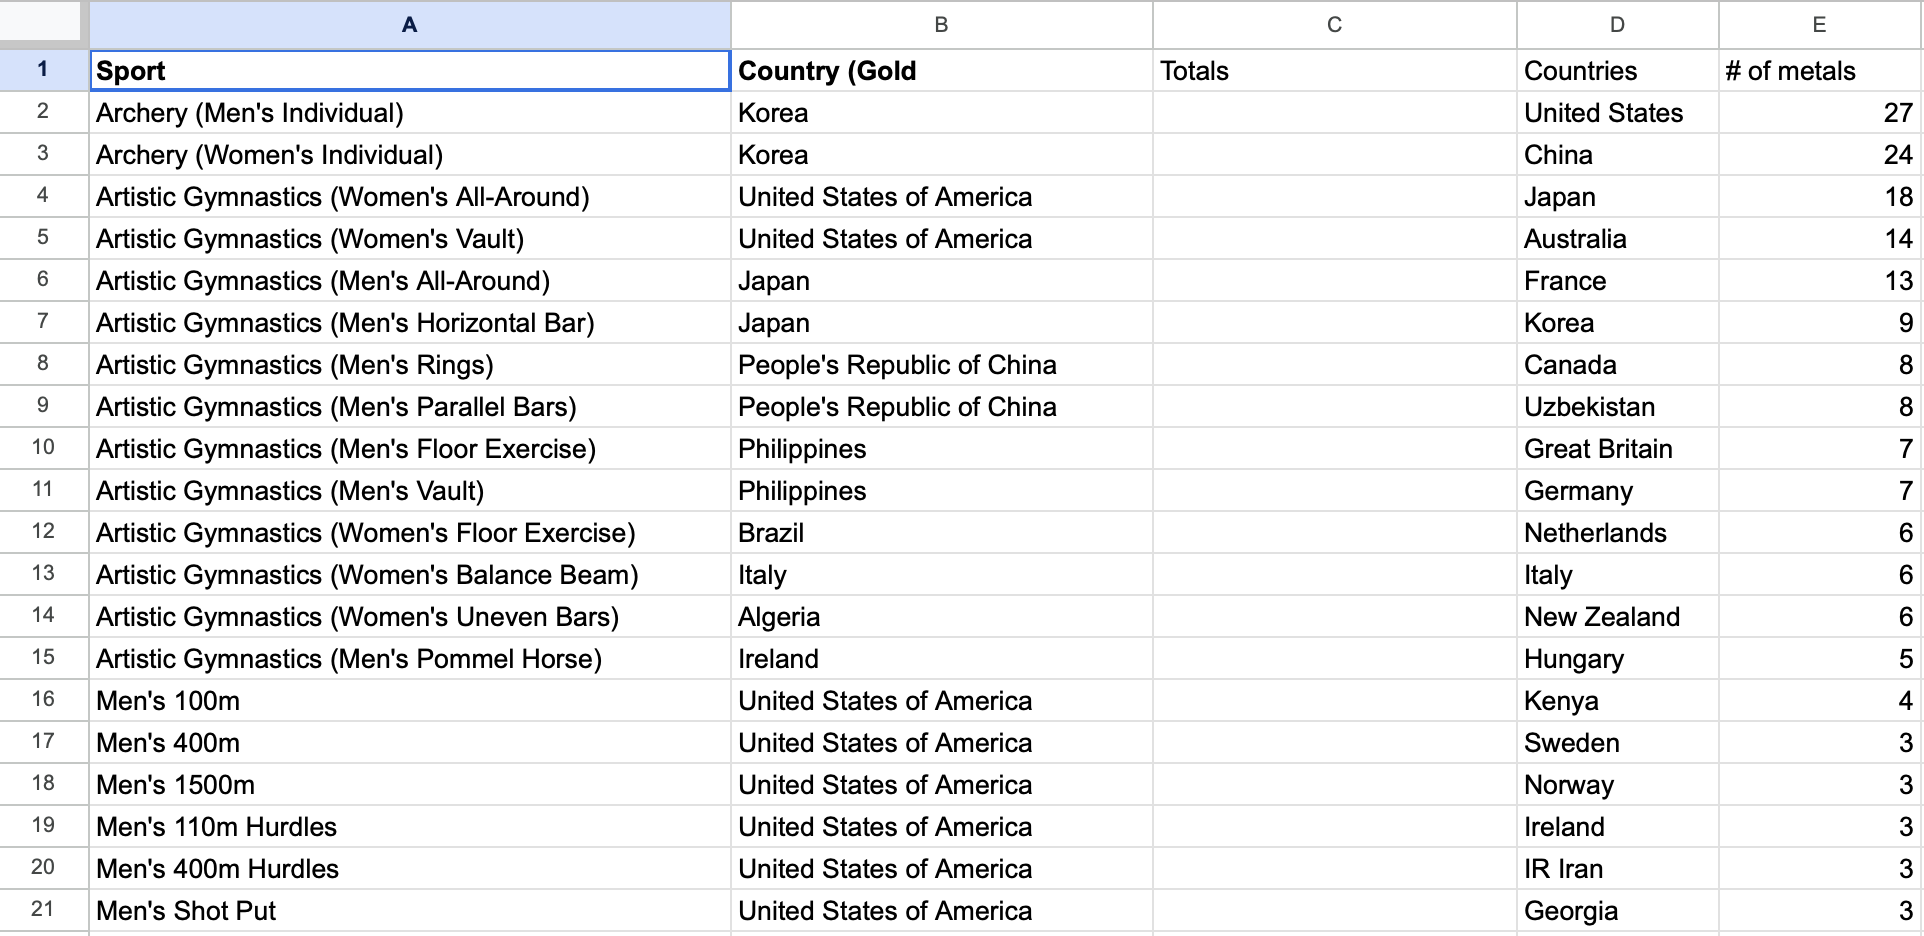
Individual Sports Results
Inital Design
I designed a single web page to showcase the data, featuring four interactive bar graphs with buttons for easy navigation through all datasets. Built with HTML, CSS, JavaScript, JSON, and arrays, the page allows users to explore the information in a clear and engaging format. At the bottom of the page, I included an analysis section that provides insights and key takeaways on the observed outcomes.
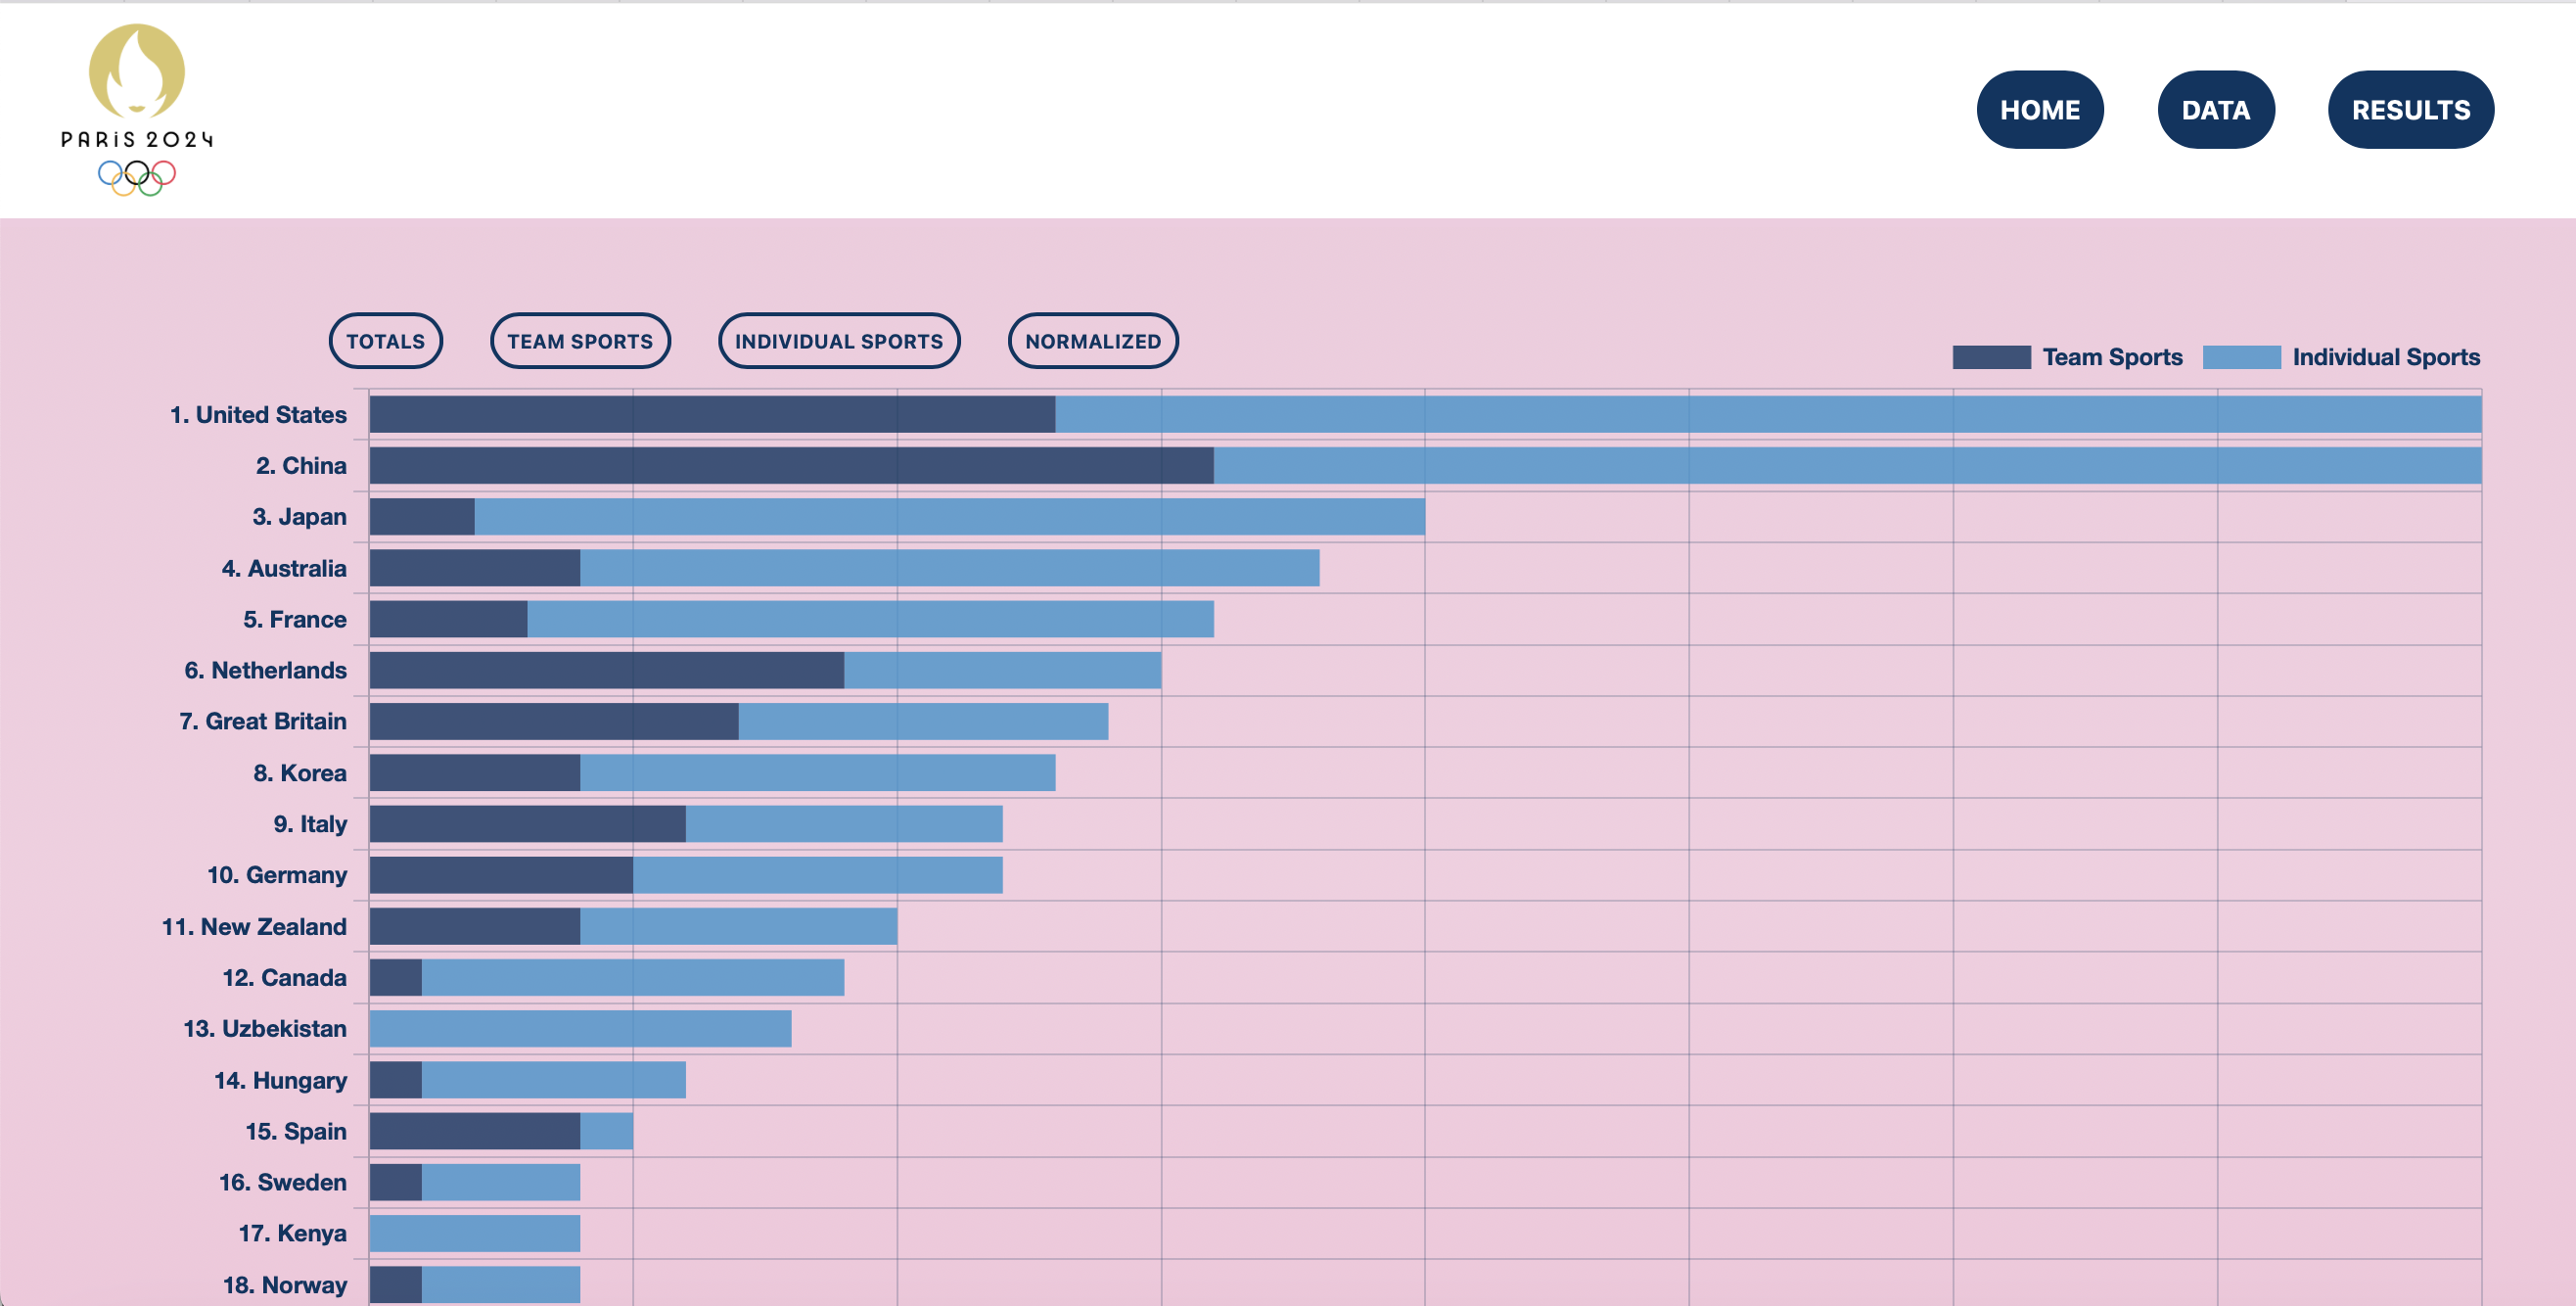
Result Bar Graphs
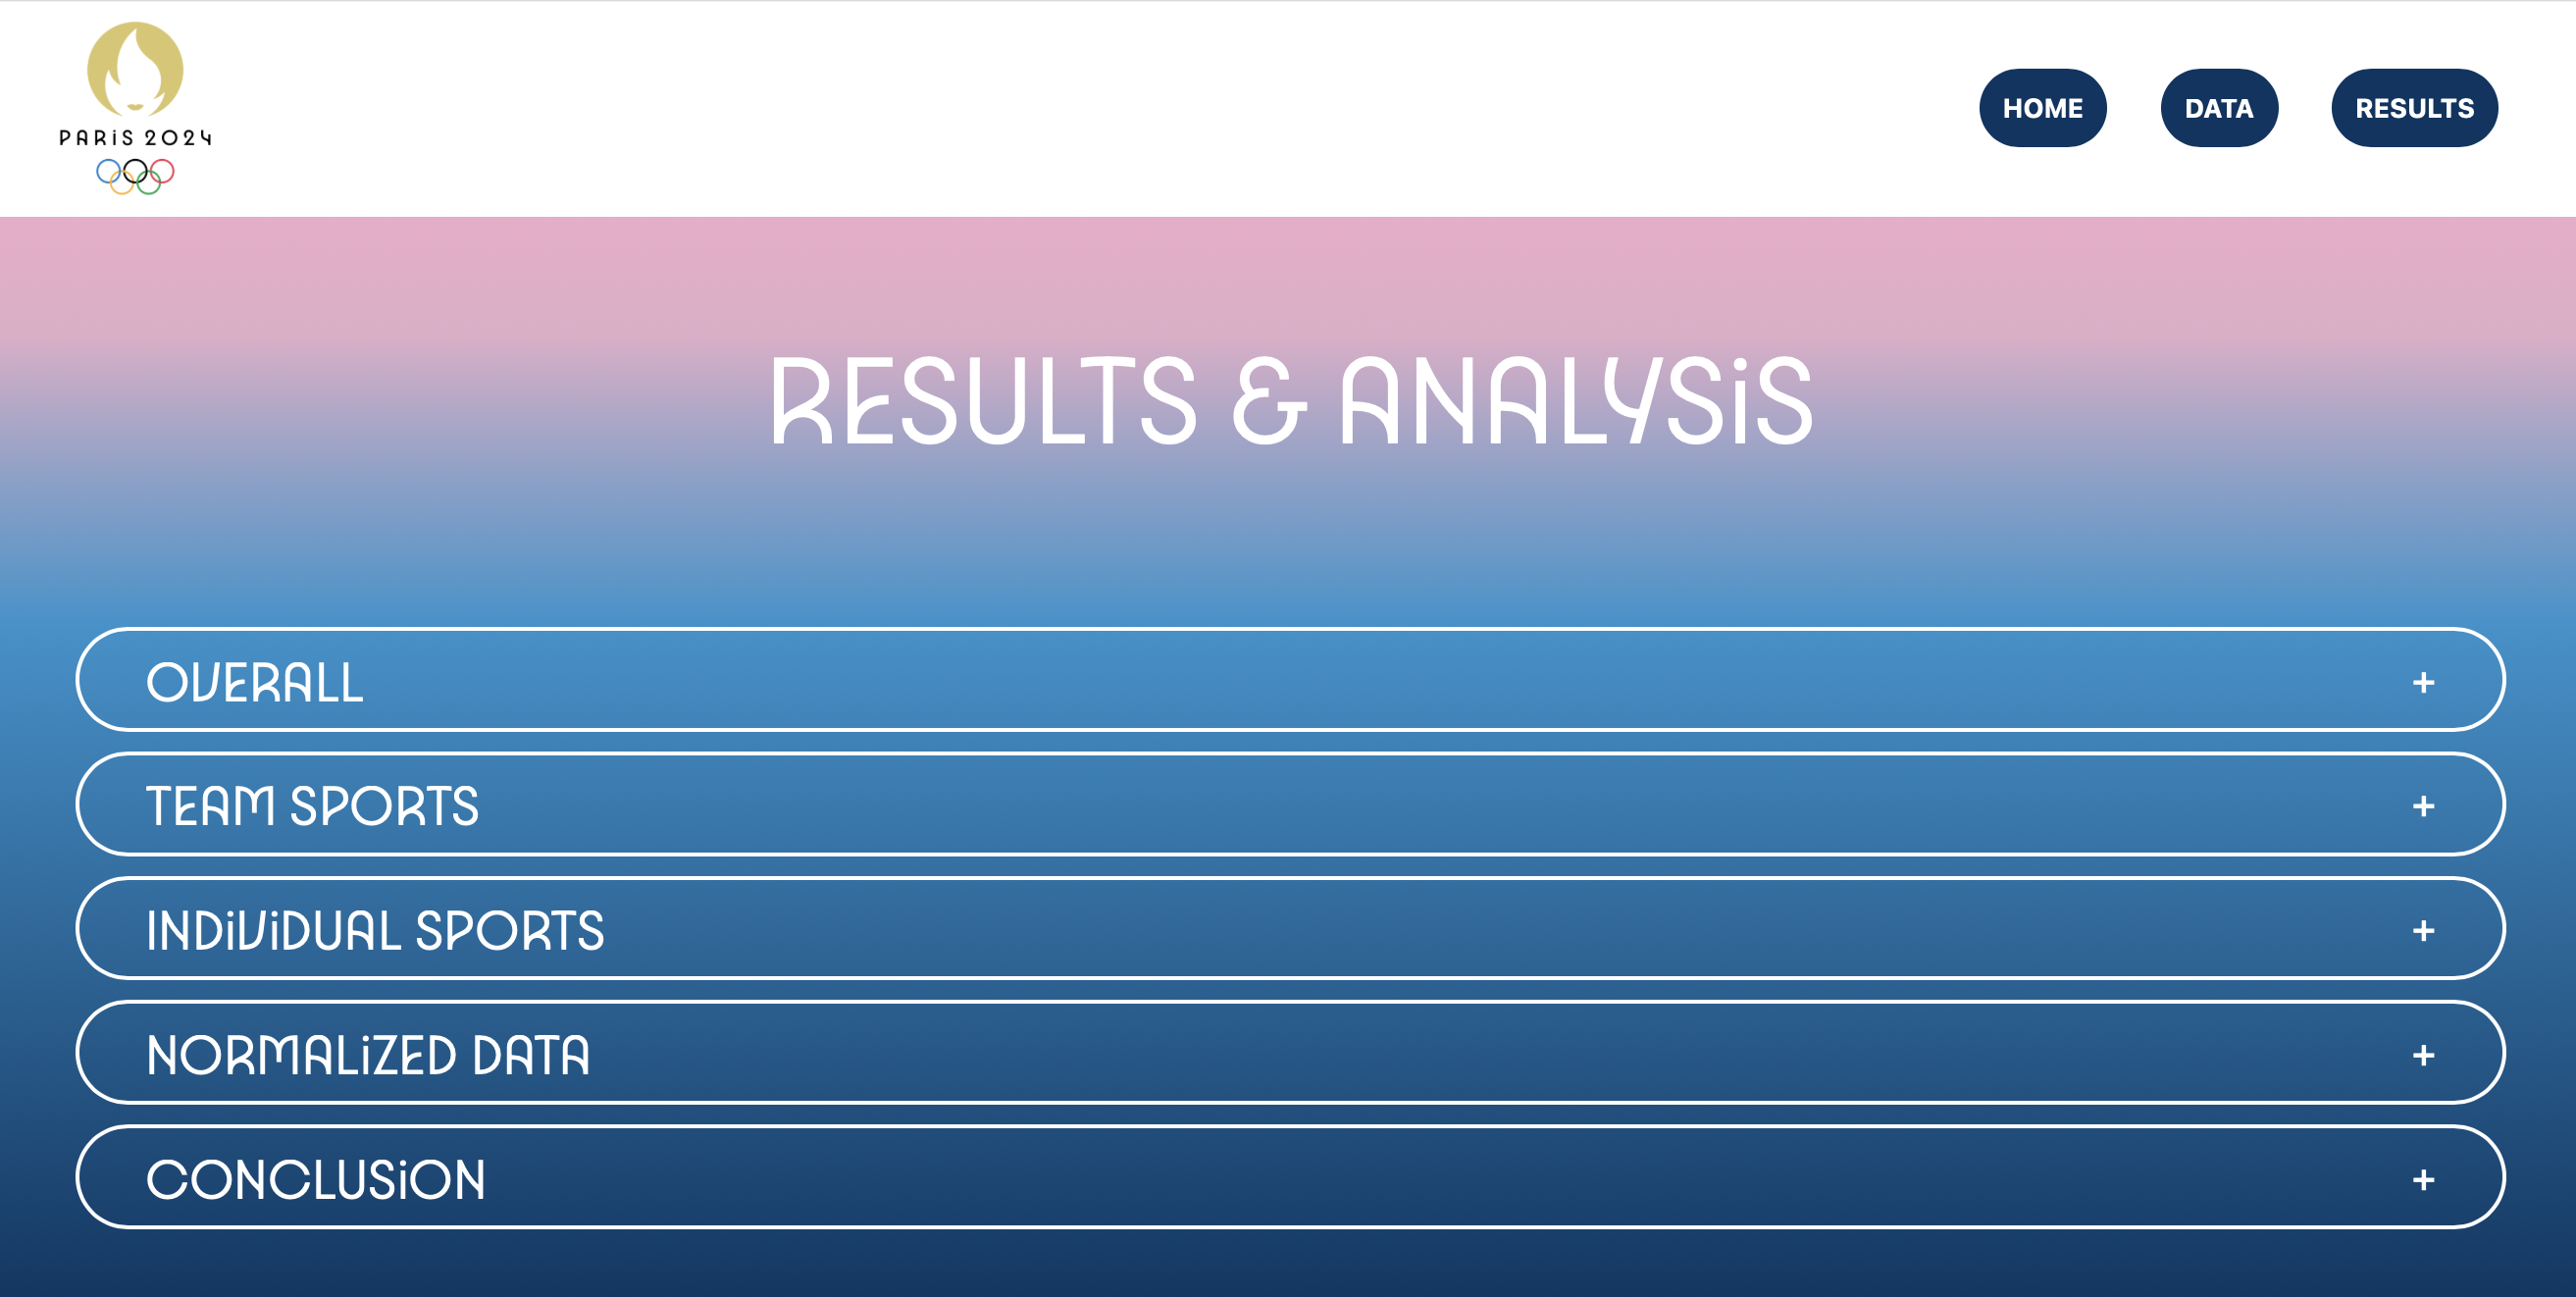
Analysis

Analysis
Research - Part 2
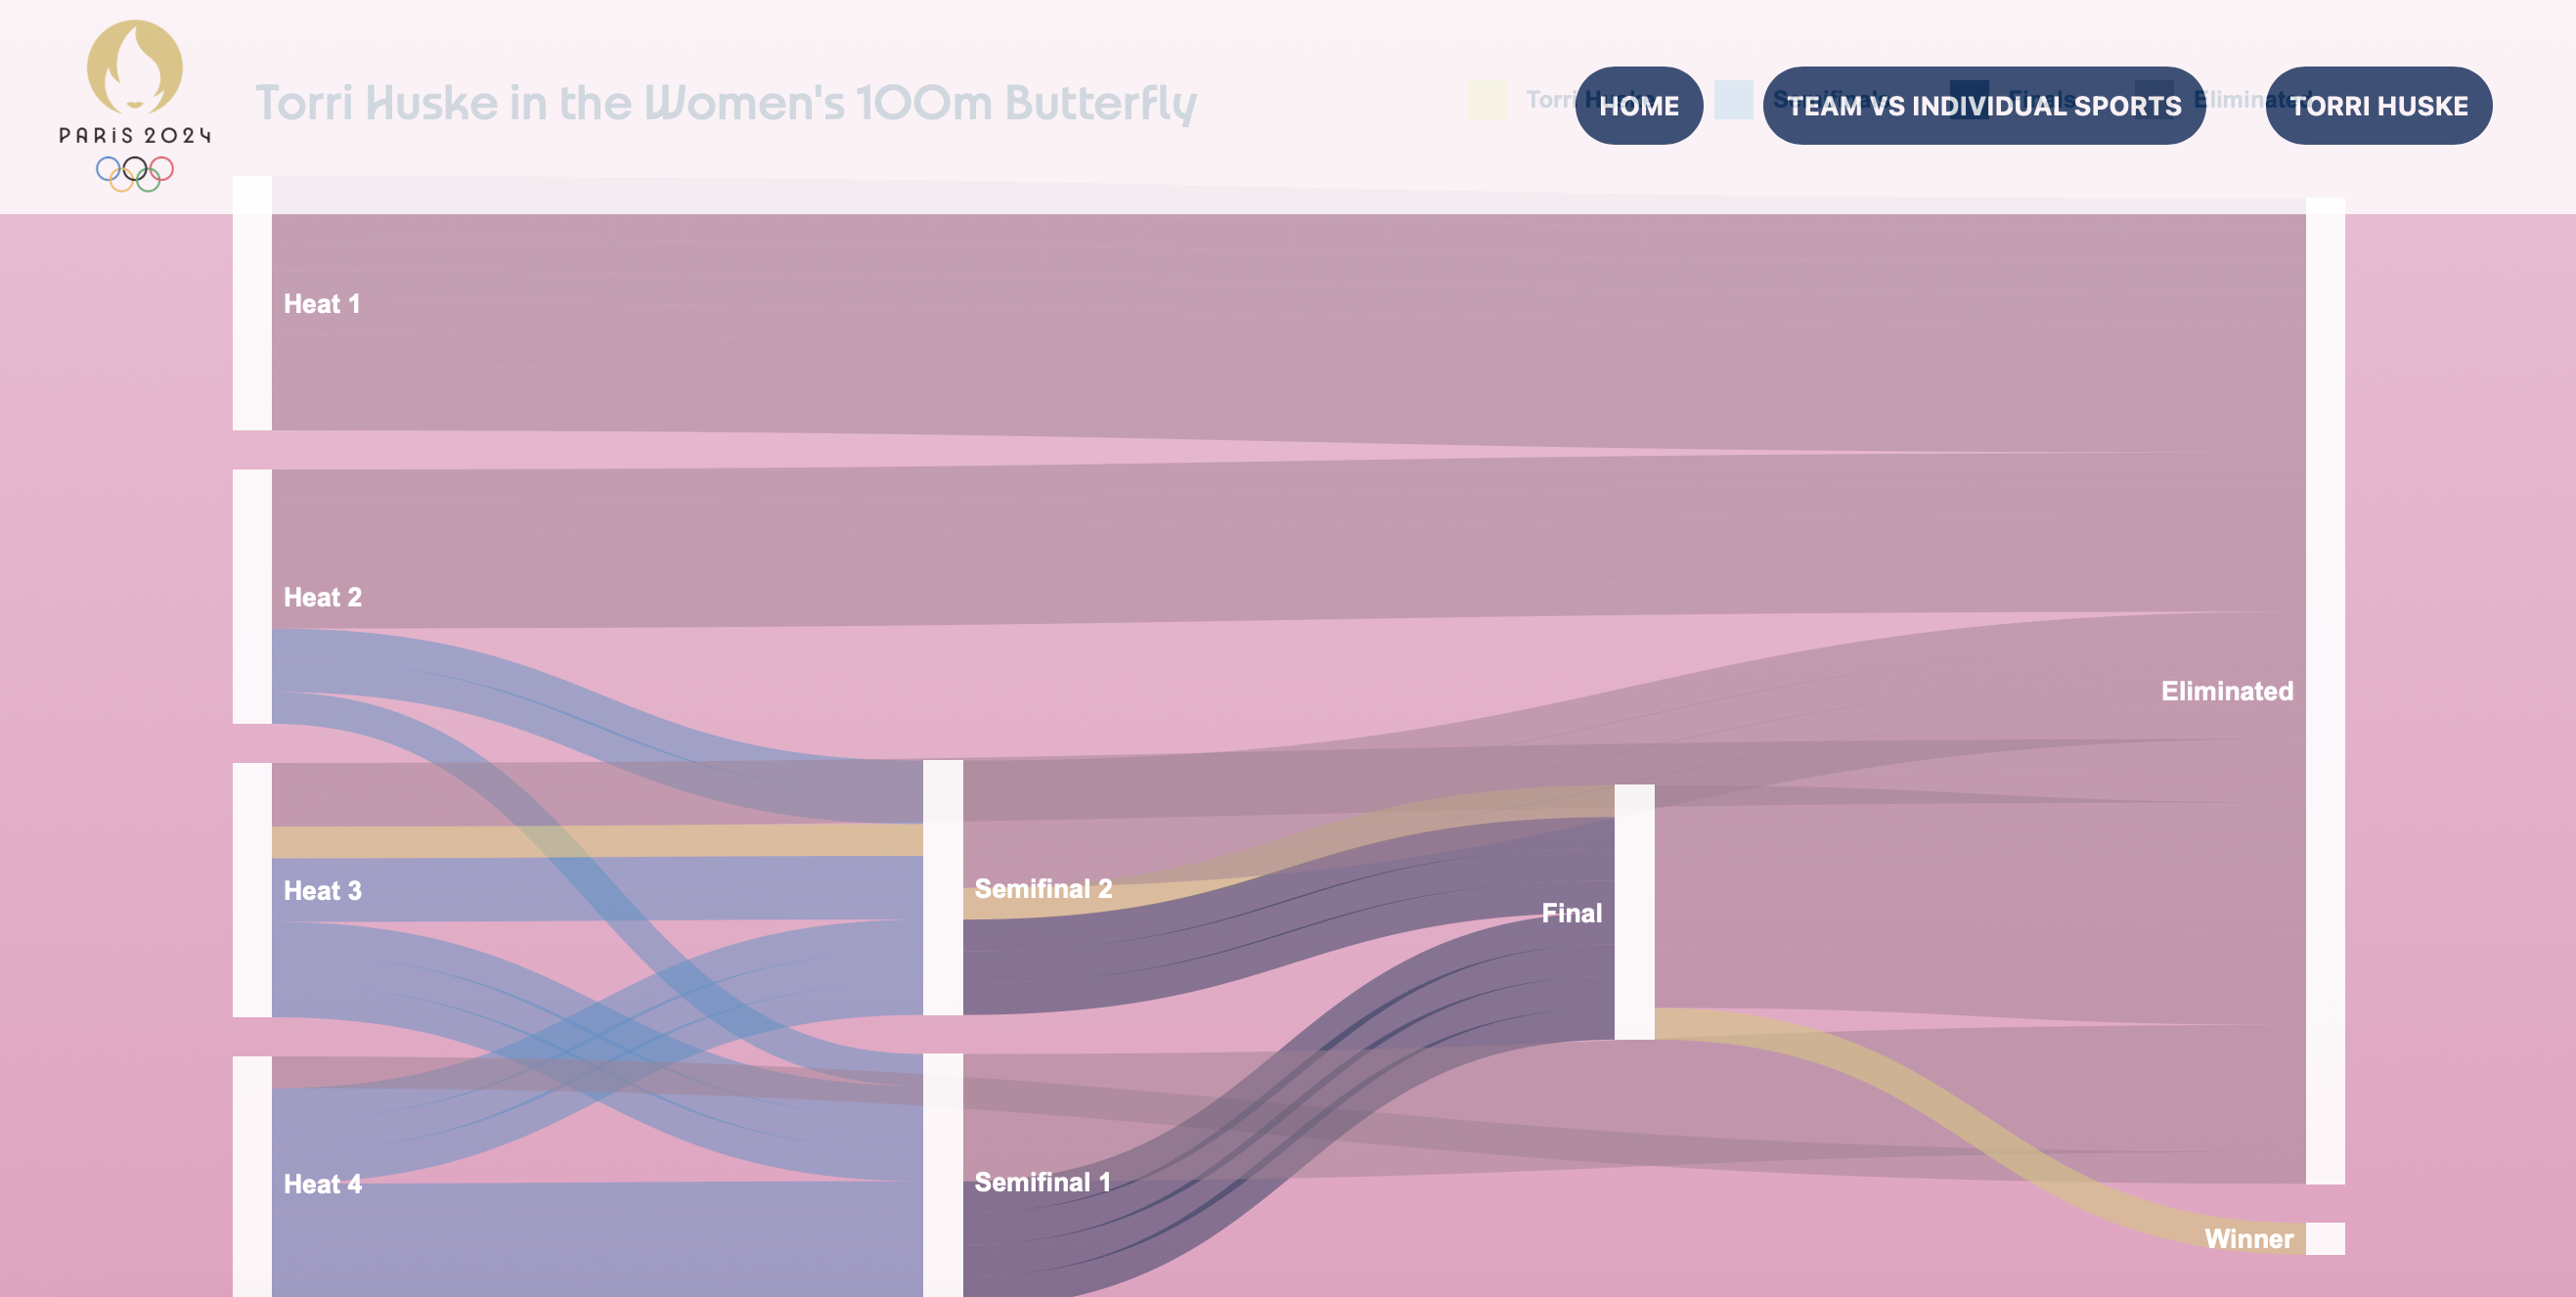
For the second analysis, I developed two detailed spreadsheets: one tracking every event in the women’s 100m butterfly race and another for the mixed 400m medley race. Each event was organized by heats, semifinals, and finals, providing a clear breakdown of competition stages.
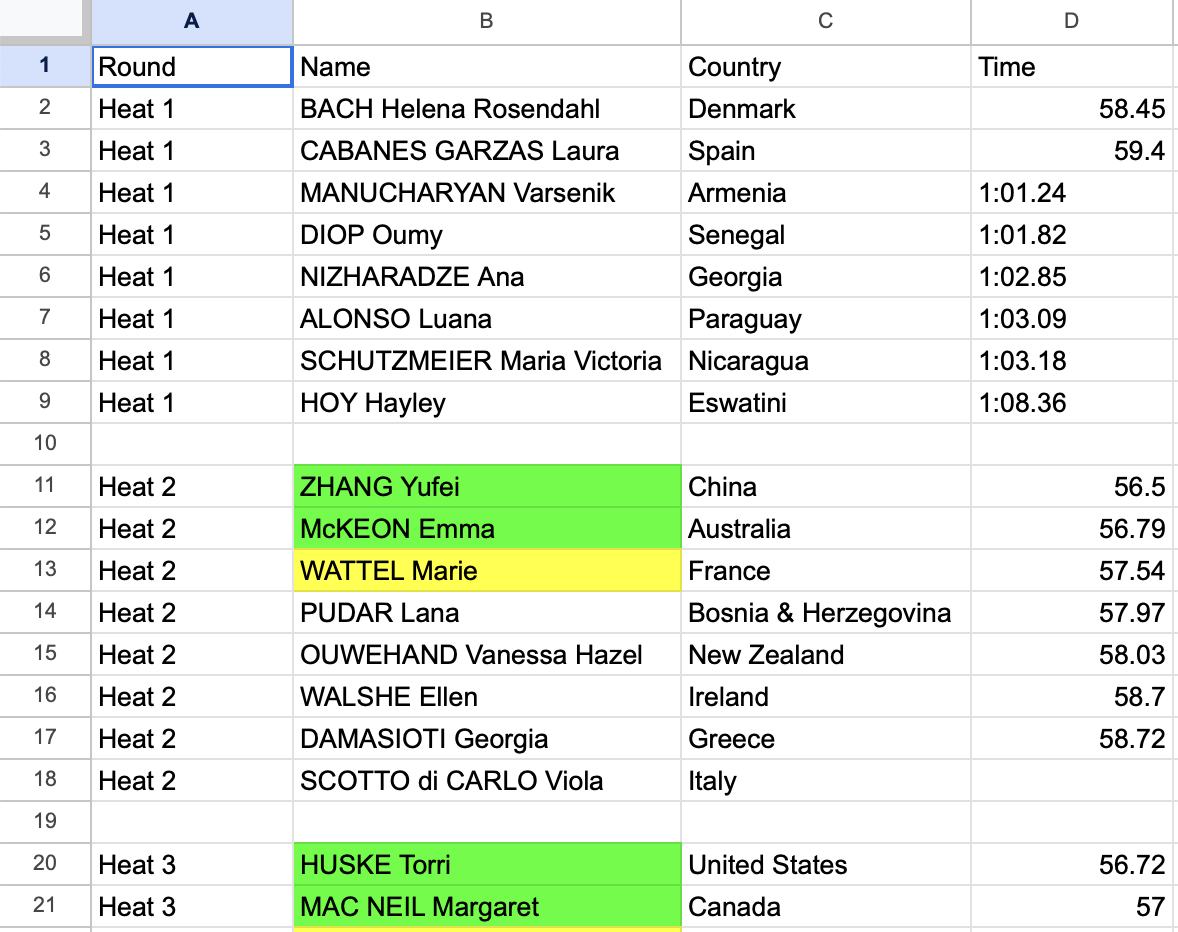
100m Butterfly Results
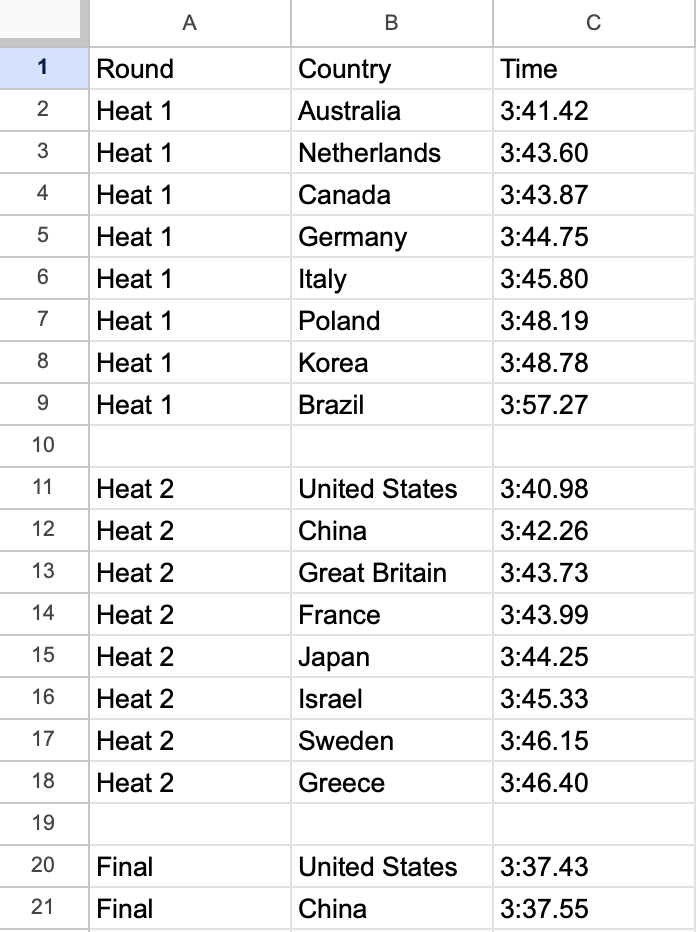
400m Mixed Medly Results
Final Design
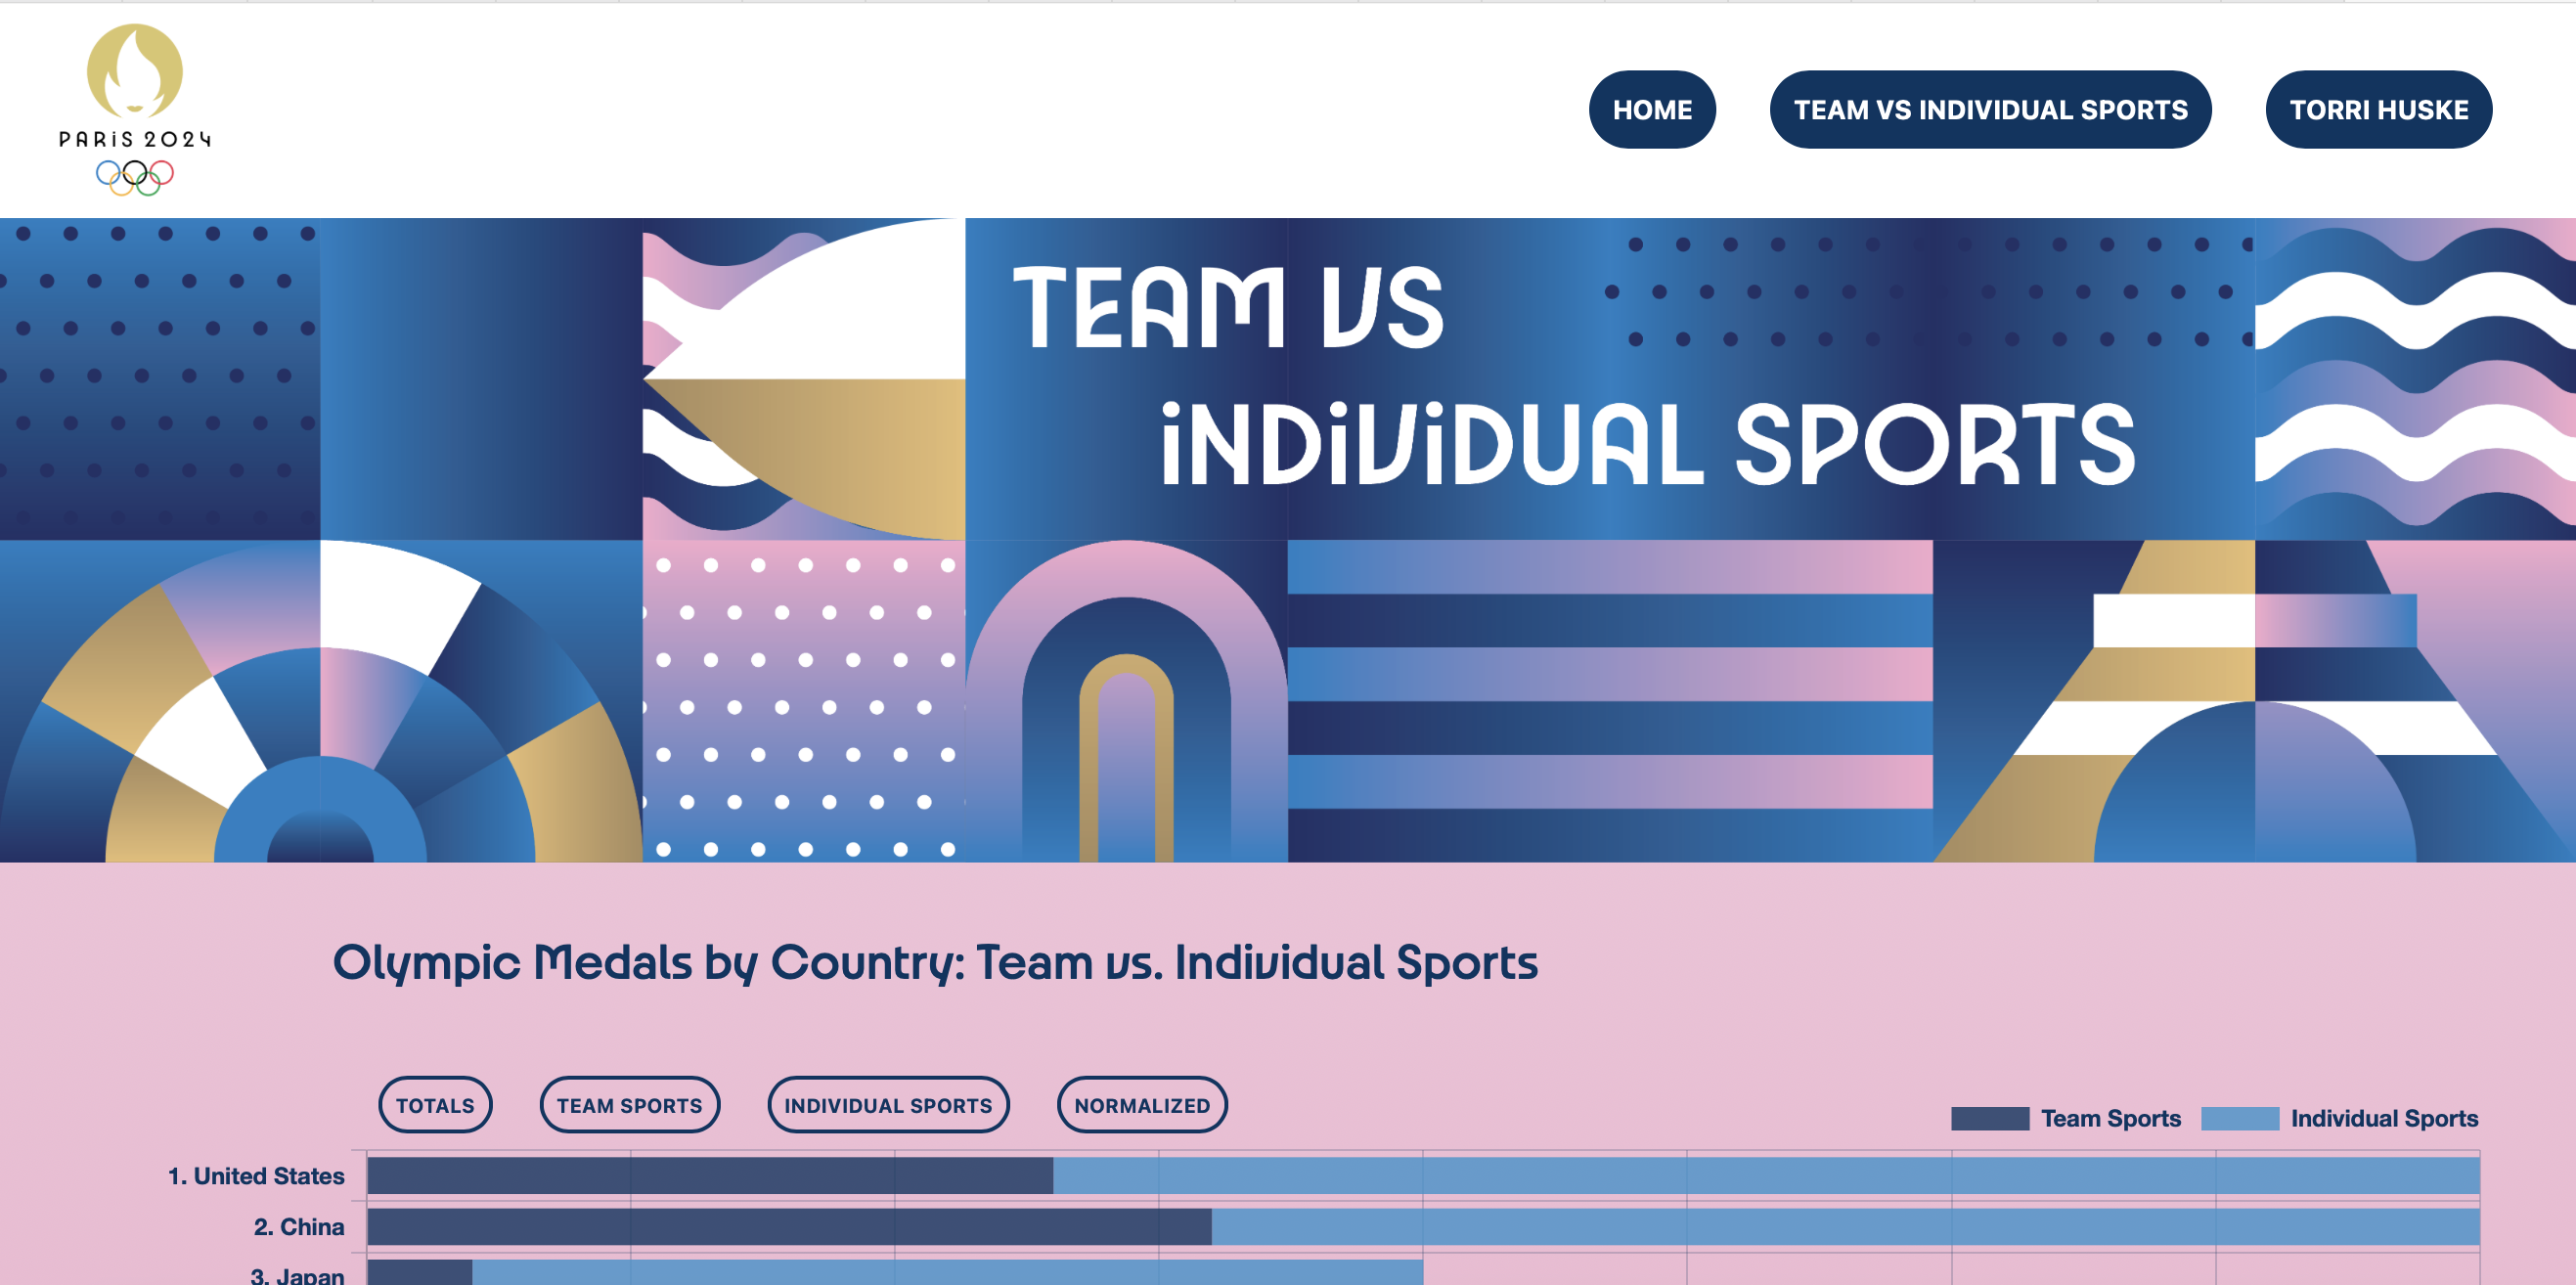
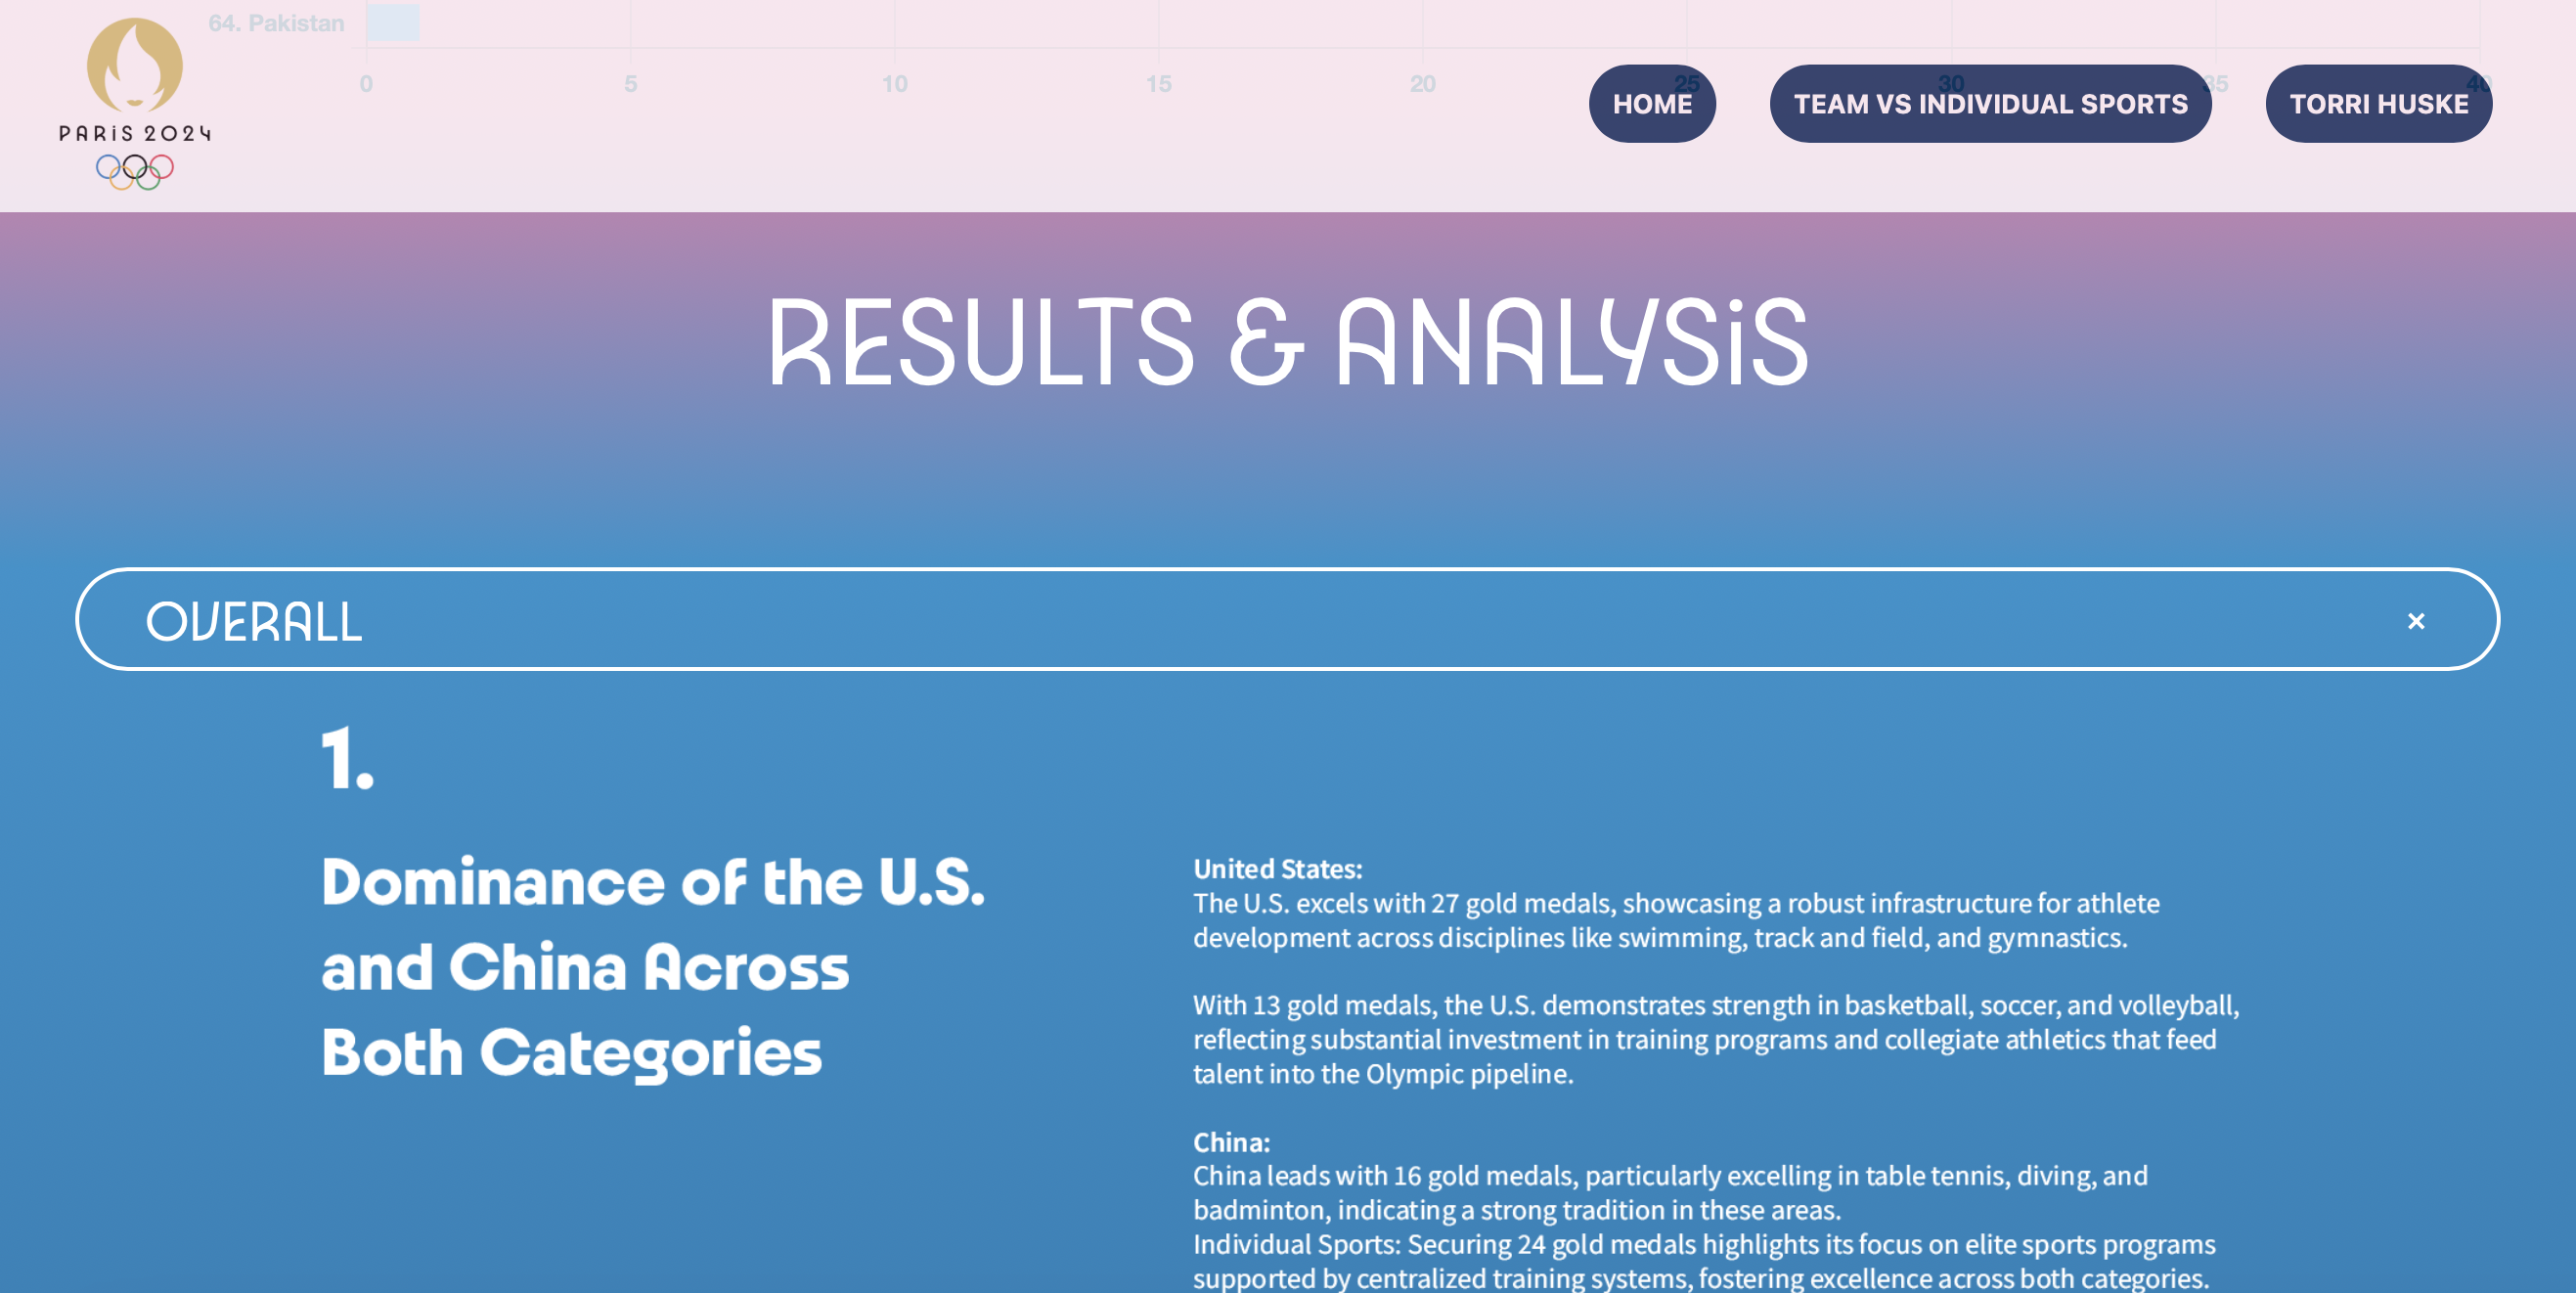
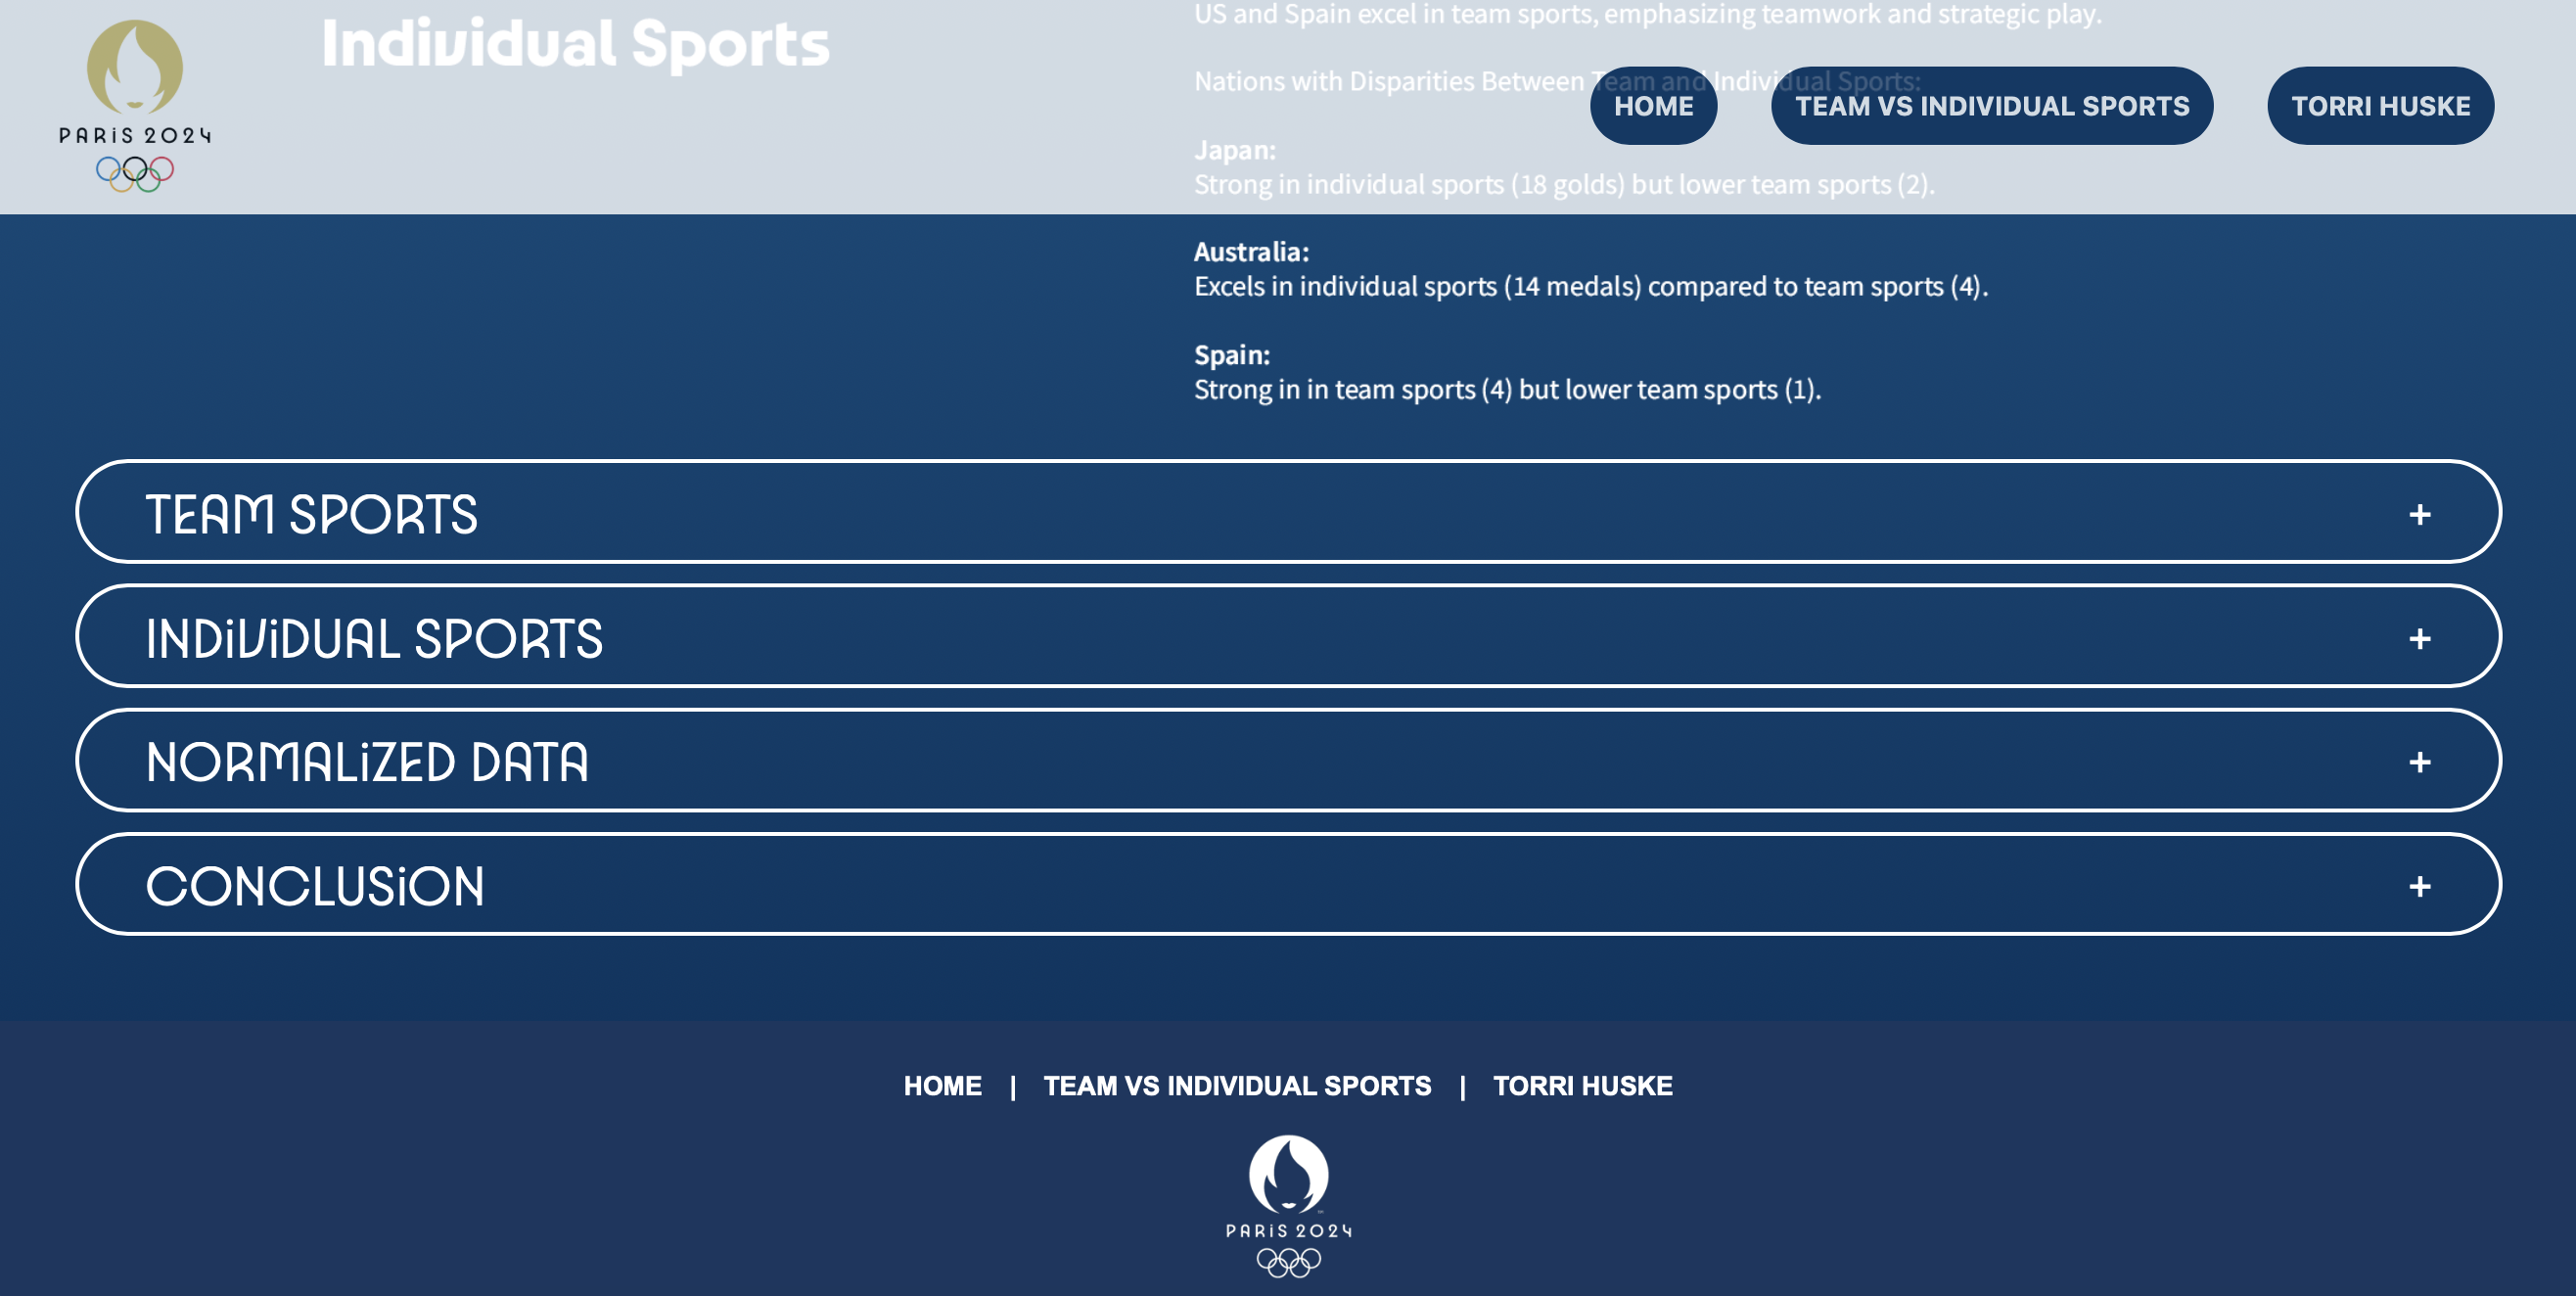
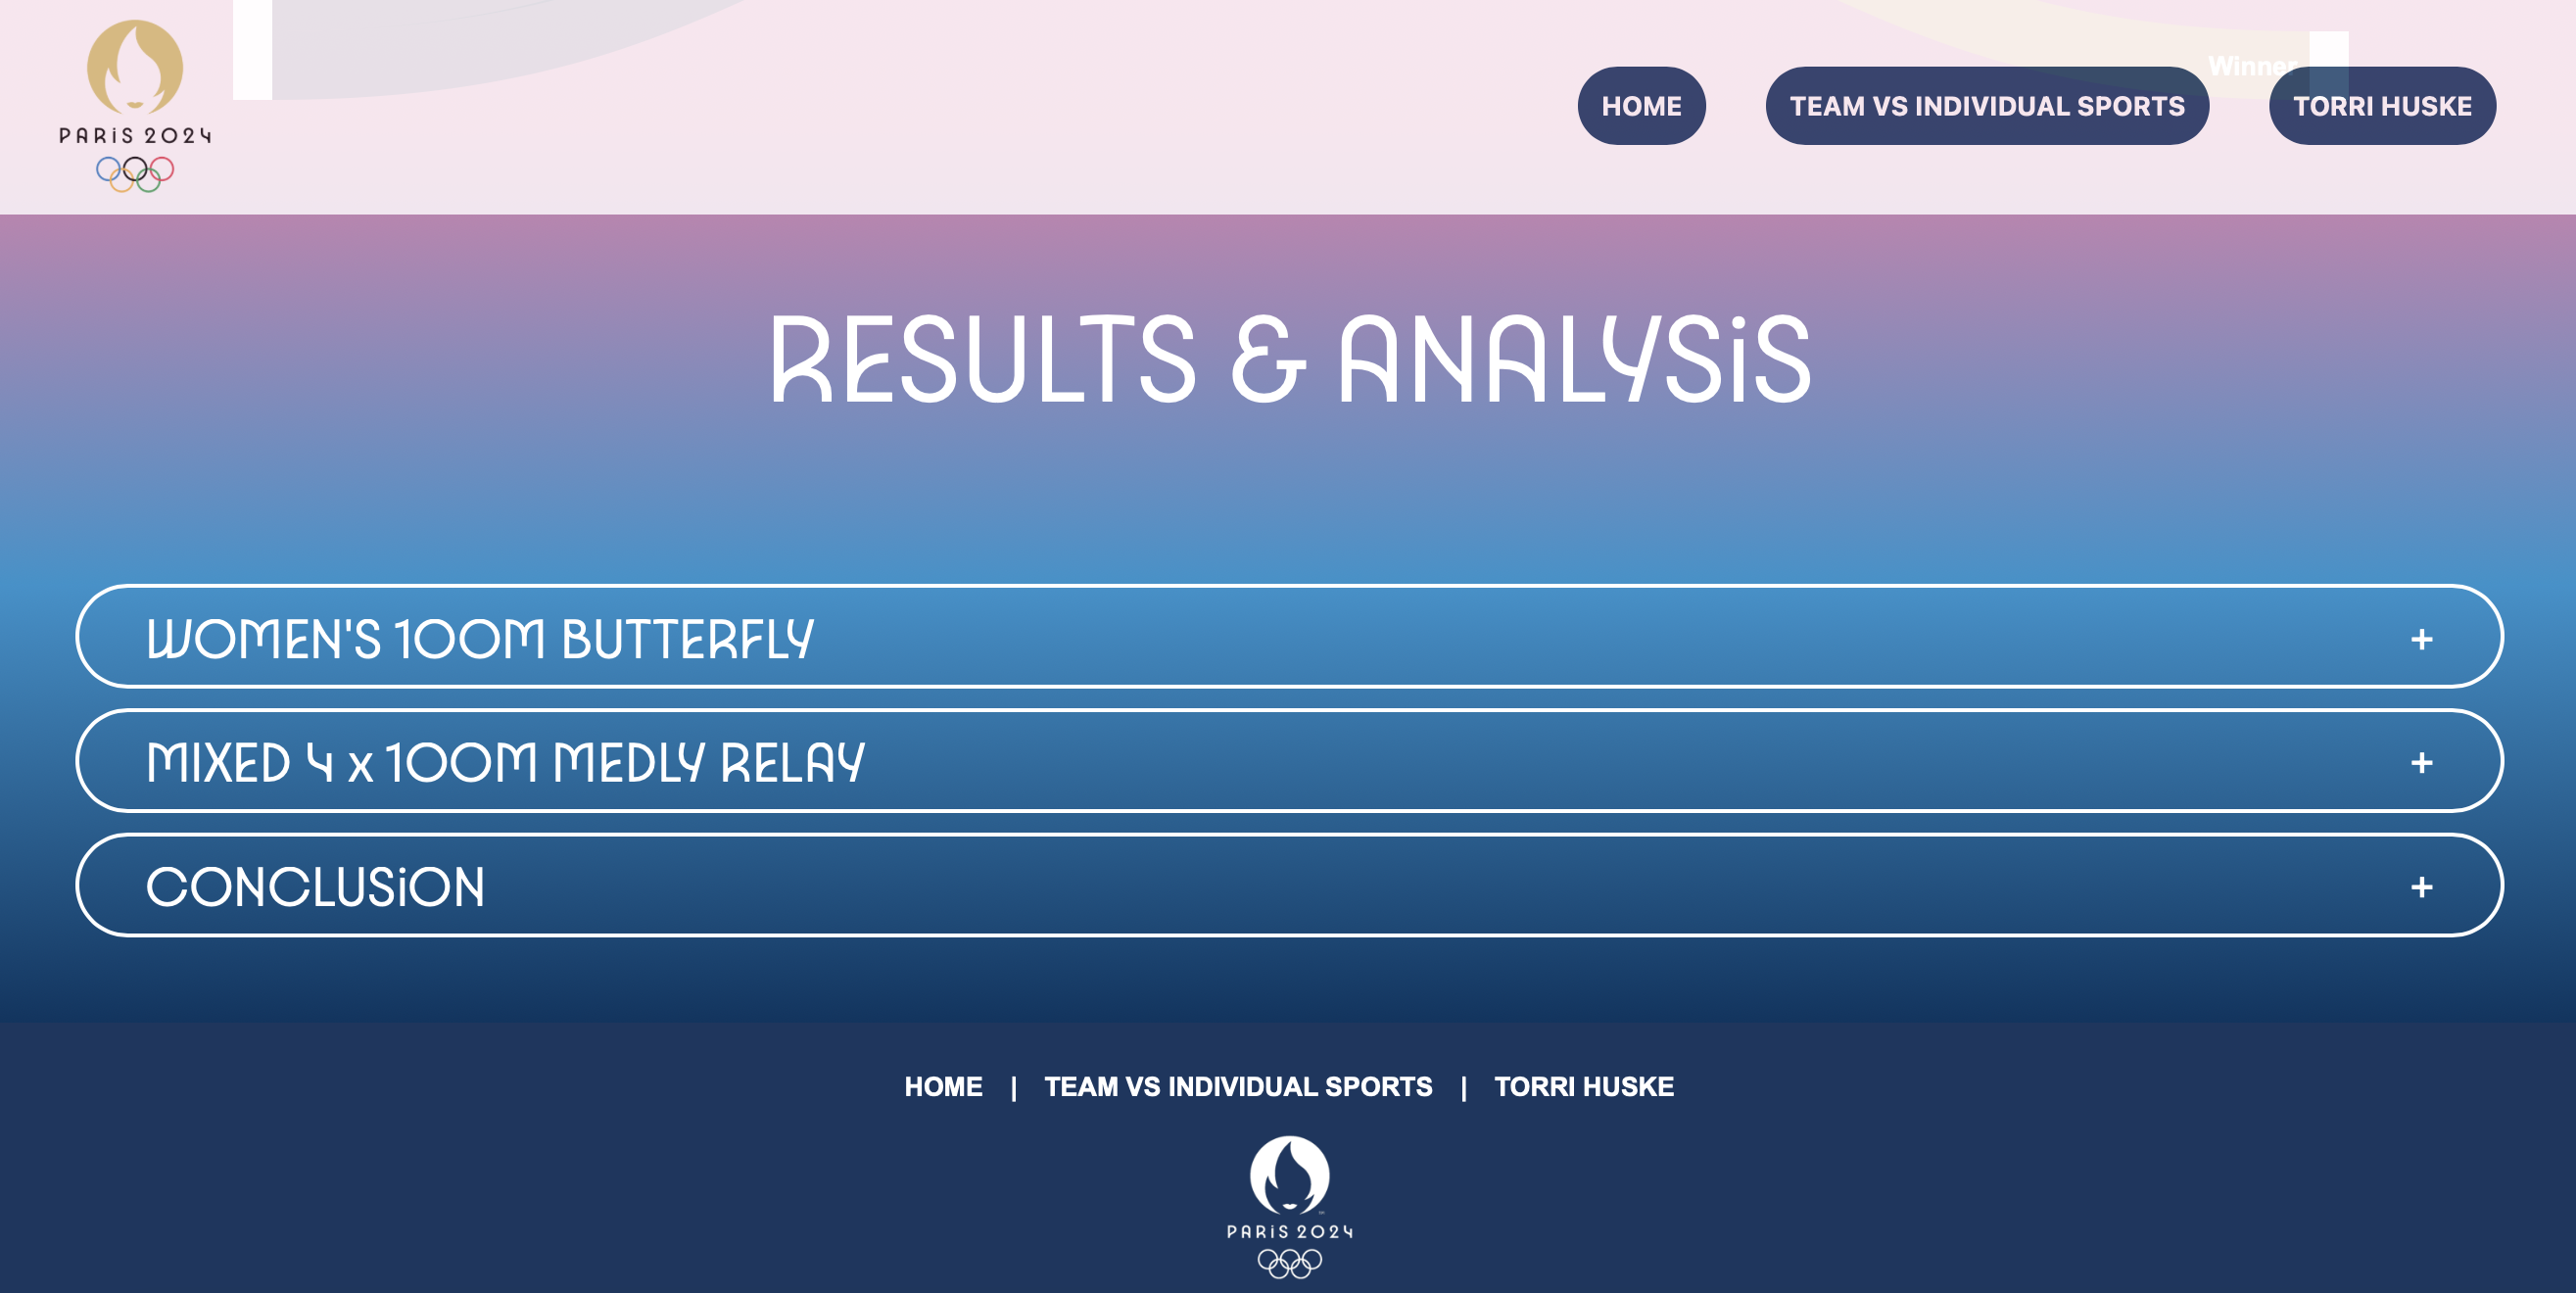
For this section, I divided the original single-page design into two distinct pages, giving the website a more organized structure. The site now opens with a home page that provides a brief introduction and overview of each section. The data from Part 1 is featured on its own dedicated page, allowing users to focus on detailed medal data and comparisons. The final page is devoted to Torri Huske’s Olympic journey, featuring two Sankey diagrams that visually map her path to gold in both individual and team events. This page also includes an analysis section at the bottom, offering insights and key outcomes from her performances.

Result Bar Graphs

Analysis

Analysis
Analysis
Analysis
Analysis

Analysis
Analysis
Analysis


